 Health |
National Wastewater Sewer Alert Network (SCAN))
Health |
National Wastewater Sewer Alert Network (SCAN))
| Don's Home
Health |
National Wastewater Sewer Alert Network (SCAN))
| Contact |
The Sewer Coronavirus Alert Network (SCAN) is a program, at Stanford with Emory University which has been expanded nationally to monitor 10 different pathogens in municipal wastewater systems; Including SARS-CoV-2, Influenza, RSV, Norovirus, Hepatitis A and others.
The unitless normalized score on the charts are for comparing a locations change over time. The numbers cannot be used to compare different locations. A score of 200 for one location does not mean the the infection rate is twice as high as a location with a score of 100.
v
The National Wastewater Sewer Coronavirus Alert Network (SCAN) has expanded with levels and trends for 10 different pathogens Nationally:
Studies in 2020 and 2021 when there was good clinical date showed a correlation between wastewater levels of SARS-CoV-2 (the virus that causes COVID-19) RNA and COVID-19 cases.
See wastewater testing
June 2024 National
| Pathogen | Concentration Category * | Trend |
|---|---|---|
| SARS-CoV-2 | High | Up Upward trend in the last 21 days |
| RSV | Low | Pathogen is seasonal and not in onset |
| Influenza A | Low | |
| Influenza B | Low | |
| Human Metapneumovirus | Low | |
| Norovirus | Medium | Downward |
| Mpox | low | 0 out of 393 samples in the past 10 days were positive |
| Rotavirus | Medium | No trend in the last 21 days |
| EVD68 | Low | 14 out of 363 samples in the past 10 days were positive |
| Candida auris fungus | 11 out of 363 samples in the past 10 days were positive | |
| Hepatitis A | Low | 37 out of 363 samples in the past 10 days were positive |
SARS-CoV-2 levels for regions:
Northeast and South are high
West and Midwest are medium.
Go to the Dashboard to find your town on the map for data.
See Wastewater SCAN West for SARS–CoV–2,: AK, AZ, CA, CO, HI, ID, MT, NM, NV, OR, UT, WA, WY

23 High sites
18 Medium sites
 9 Low sites
| Location | Concentration Category |
|---|---|
| Nation | High |
| West & Midwest | Medium |
| Northeast & South | High |
|
California 23 High sites 18 Medium sites 9 Low sites 50 Total SCAN sites |
|
| Sacramento | High |
| Woodland | Low |
| Davis | High |
| Winters | Low |
| Napa | High |
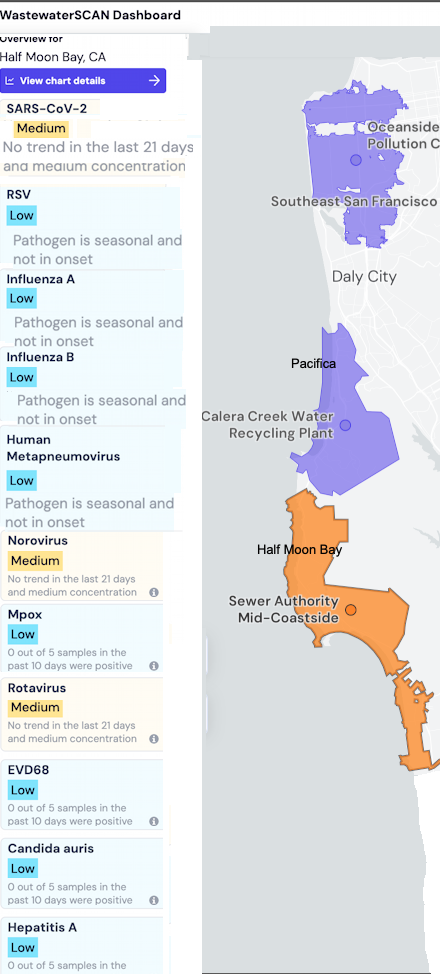
| Half Moon bay | Medium |
| Palo Alto | Low |
Unitless number on the charts
called "Quantity of Nucleic-acids"
 on the chart:
National     110-425
West         100-575
Davis         35-425
Sacramento    70-450
Half Moon Bay 70-500
The trend is the comparison of the current 5 day average value with one 3 weeks earlirer.
How are categories (High, Medium, Low) determined:
Using the range of values from the last year,
levels are divided into thirds (lower=<33rd percentile) etc.)
Wastewater Category (High-Medium-Low) is a function of Level and trend
You may notice that the top third area often represents a larger range than the middle or bottom - this is because there is typically more variability in the concentrations in the top of third of data points.
