 Forecasts vs Actual
Polling has always been an inexact science, but some of the forecasting models have become fairly sophisticated. They do simulations with polling results, taking into account things like sample size and historical accuracy.
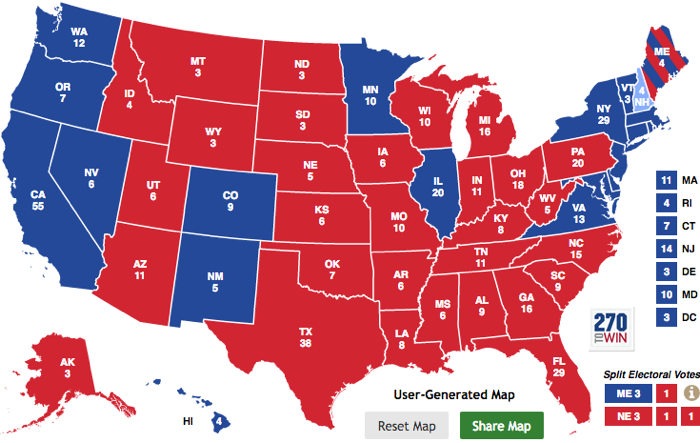
None of the forecasts predicted the result, a Trump Win, in the 2016 election.
See Forecasts - The New York Times.
None of the 19 states considered solid Democratic states, e.g. Hawaii, Vermont, New York, Massachusetts, California, ... went Republican. It was the 15 or so states considered battleground states and specifically Michigan and Wisconsin where Clinton was considered to have a 3.5% - 6% lead that made the difference. Polls in Florida and North Carolina went back and forth in the week before the election.
RealClear Politics came the closest getting 4 states wrong and FiveThirtyEight got 5 states wrong, but they tipped the election.
See Presidential elections
Chance of Winning:
                     Clinton  Trump
FiveThirtyEight        71%     29%
NY Times The Upshot  84%     16%
Huffington Post        98%      1.5%
Popular Vote and Electoral College (EC) Votes:
| Candidate | 538 | RCP | Huffing-
ton ECV | Actual |
| Pop Vote | EC Vote | EC Vote | Pop Vote | EC Vote * |
| Trump | 44.9% |
235 |
266 |
215 |
62,979,879 |
46.0% |
304 |
| Clinton | 48.5% |
302 |
272 |
332 |
65,844,954 |
48.0% |
227 |
| Johnson | | 4,488,919 |
3.3% |
| Stein | | 1,457,044 |
1.1% |
| Write-in | | 1,103,554 |
0.8% |
| McMullin | | 725,902 |
0.5% |
| other | | 453,664 |
0.3% |
* 306 electors were pledged to vote for Trump but 2 voted for someone else.
232 electors were pledged to vote for Clinton but 5 voted for someone else.
Models:
538 - 2016 Election Forecast | FiveThirtyEight
RCP - RealClearPolitics - 2016 Election Maps
CNN 2016 Electoral Map (Interactive)
NY Times The Upshot
Huffington Post
270ToWin.com

Results:
RealClearPolitics - Opinion, News, Analysis, Video and Polls
Election Results 2016 - The New York Times
RealClearPolitics

Ryan Grim at the Huffington Post says "Nate Silver Is Unskewing Polls -- In Trump's Direction"
Nate Silver (538) didn't get it right but got closer than Huffington Post.
See Other Forecasts - The New York Times
Swing State Forecasts and Results:
| State | 538 | RCP | Huffington | CNN | 270 | Final | ECV |
| margin | | margin | | | | margin |
| Florida | C | 0.6% | T | 0.2% | C | 1.6% | U | U | T | 1.4% | 29 |
| North Carolina | C | 0.7% | T | 1.0% | C | 1.4% | U | U | T | 3.8% | 15 |
| Nevada | C | 1.2% | T | 0.8% | C | | U | U | C | 4.2% | 6 |
| New Hampshire | C | 3.6% | C | 0.6% | C | | U | U | C | 0.1% | 4 |
| Pennsylvania | C | 3.7% | C | 1.9% | C | | C | C | T | 1.1% | 20 |
| Colorado | C | 4.1% | C | 2.9% | C | | C | C | C | 2.2% | 9 |
| Michigan | C | 4.2% | C | 3.4% | C | | C | U | T | 0.3% | 16 |
| Wisconsin | C | 5.3% | C | 6.5% | C | | C | C | T | 1.0% | 10 |
| Minnesota | C | 5.8% | C | 0.0% | C | | C | C | C | 1.4% | 10 |
| Virginia | C | 5.5% | C | 5.0% | C | | C | C | C | 4.7% | 13 |
| Maine (at large) | C | 7.5% | C | 4.5% | C | | C | C | C | 2.7% | 4 |
| Republican |
| Ohio | T | 1.9% | T | 3.5% | T | 1.0% | T | U | T | 8.6% | 18 |
| Arizona | T | 2.2% | T | 4.0% | T | 2.1% | U | U | T | 4.2% | 11 |
| Iowa | T | 2.9% | T | 3.0% | T | | T | U | T | 9.4% | 6 |
| Georgia | T | 4.0% | T | 4.8% | T | 2.4% | T | T | T | 5.7% | 16 |
| Utah | T | 10.6% | T | | T | | T | T | T | 16.9% | 16 |
|
| National | C | 3.5% | | C† | 0.14% | |
† Clinton won the popular vote but lost the Electoral Vote
* Utah has a 3rd party candidate, McMulin, getting 27.9%
Other Forecasts:
At the end of September American University Professor Allan Lichtman predicted Trump would win.
He has correctly predicted the results of every presidential election since 1984
 using his system of 13 "keys." His book,
 "Predicting the Next President: The Keys to the White House" explains how he does it.
If 6 of the 13 keys are true he predicts that party in power will loose.
On Nov. 3 he was on Fox news and hedged his bet because of Trumps uniqueness,
but said he would stick by his prediction that he would win.
Summary:
Trump was the first Republican since 1988 (H.W. Bush - Dukakis) to win Michigan, Wisconsin or Pennsylvania.
At What A Difference 2 Percentage Points Makes | FiveThirtyEight Nate Silver says,
A 1% shift of popular vote from Trump to Clinton (a 2% shift in the spread) in Michigan, Wisconsin and Pennsylvania would produce add 46 electoral votes to Clinton making her the winner.
The GOP has learned that there's a bigger market for populism, and a far smaller one for movement conservatism, than many of us imagined.
The divide between cultural "elites" in urban coastal cities and the rest of the country is greater than ever. Clinton improved on President Obama's performance in portions of the country, such as California, Atlanta and the island of Manhattan. But whereas Obama won Iowa by 10 percentage points in 2008, Clinton lost it by 10 points.
Demographics:
Clinton beat Trump with Millennials (generally 18-40 year olds) everywhere but Idaho, Wyoming, North Dakota, Kentucky and West Virginia.
Trump got 53% of the male vote and 42% of the female vote.
He got 53% of the white female vote and 4% of the black female vote.
Clinton got a majority of people with college degrees. Trump got a majority of the less educated.
Trump got 67% of whites without a college degree.
Clinton got 75% of non-whites without a college degree
Trump got 58% of the white (70% of voters) vote. Clinton got 88% of the black (12%) vote, 65% of the latino (11%) vote and 65% of the asian (4%) vote.
Clinton got a majority of families which make less than $50,000 per year.
They were fairly evenly split for higher income levels.
Clinton got 59% of the city vote. Trump got 62% of the rural vote.
Clinton got 52% of people who define themselves as politically moderate.
Trump got 81% of white evangelical or born-again Christians.
See more at exit poll data.
Links:
2016 Election Postmortem
2016 Presidential Election Forecast Maps - 270toWin.com
How we voted -- by age, education, race and sexual orientation | Election 2016 News for College Students | USA TODAY College
See Conservatives for some of the things which may come into play in a Trump presidency.
List of United States presidential elections by popular vote margin - Wikipedia
last updated - 24 Dec 2016
|
 Politics