|
|
| Financial Planning | Budgeting | Saving | Investing | Retirement | Senior Living Costs | Asset Classes | Real Estate | Interest Rates | Charts | Market Indicators| Market Sectors | Inflation (CPI) |

Contents:
See Also: Stock Brokers
History:
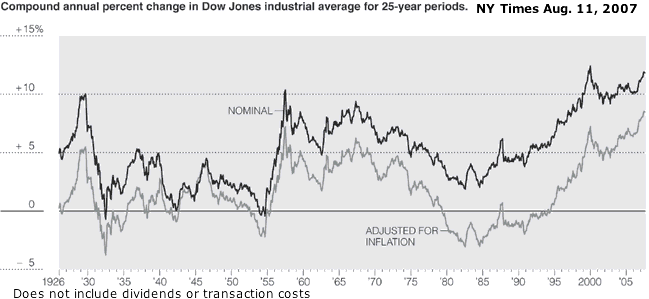
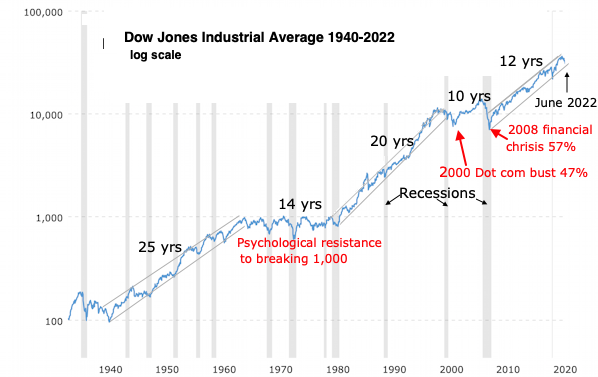
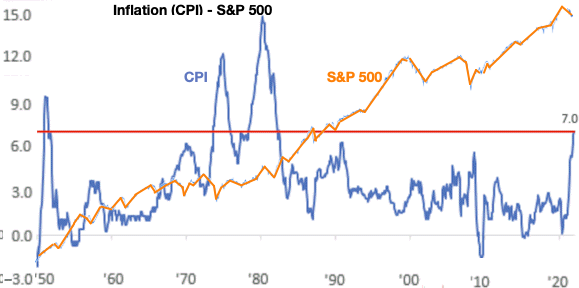
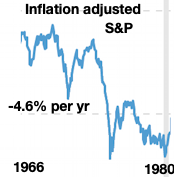
See also Benchmarks MSCI - S&P See inflation below for the effect of inflation in the 70s and 80s. The market price didn't tank but if you look at inflation adjusted returns it did.
The tech heavy NASDAQ had a 26% run up from 1995-2000, but lost it all in the .com bust.
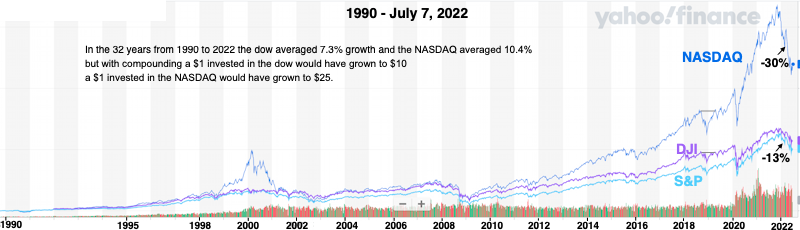
In the 32 years from 1990 to 2022 the dow averaged 7.3% growth and the NASDAQ averaged 10.4%,
Reference Sources: | |||||||||||||||||||||||||||||||||||||||||||||||||||||||||||||||||||||||||||||||||||||||||||||||||||||||||||||||||||||||||||||||||||||||||||||||||||||||||||||||||
|
Daily News: money.cnn.com Bloomberg.com Yahoo Finance Google Finance MarketWatch.com TheStreet.com Financial Times Wall Street Journal Investor's Business Daily Forbes Breaking News AP Breaking News at BusinessWeek AG Edwards Market Monitor Fidelity Markets & Sectors Weekley - Monthly News: Money Magazine at money.cnn Barrons Business Week Forbes Investement Guidance: Motley Fool Seeking Alpha - High Dividend Investing |
Blogs: Make Me Smart - podcast | NPR Marketplace Seeking Alpha Bill Cara CXO Advisory Group - Steve LeCompte Random Roger's Big Picture The Kirk Report
2005 Best Financial BLogs at CNN Money
Charts:
Other: | ||||||||||||||||||||||||||||||||||||||||||||||||||||||||||||||||||||||||||||||||||||||||||||||||||||||||||||||||||||||||||||||||||||||||||||||||||||||||||||||||
|
Where to get good advice:
The QXO Advisory Group (Steve LeCompte) tabulates the market forecasts of 42 major market commentators and forecasters. The top forecasters as of June, 2007 were Ken Fisher in Forbes, David Nassar, Louis Navellier and James Oberweis at MarketWatch.com and Jack Schannep at zacks.com, and Jason kelly at JasonKelly.com with 60-72% accuracy. Only 18 were better than 50% and 24 were accurate only half or less of the time.
The Hulbert Financial Digest (HFD) tracks the performance of over 180 investment newsletters.
**Risk-adjusted performance. We use the Sharpe Ratio to calculate risk-adjusted performance. Higher numbers mean that the adviser did better in relation to the amount of risk he/she incurred. Jim Cramer's Mad Money picks can move a stock up in the short run, but according to the old web site "CramerWatch.org", after 30 days he is right only 49% of the time.
Value Line is a service that ranks stocks from 1 to 5 for timeliness. They claim their recommendations beat the market, however the Value Line Fund, which uses the Value Line ranking system to direct its stock picks has churned out so-so performance numbers relative to other large-growth funds.
Mutual Funds:
An 2001 A.G. Edwards study illustrated the unpredictable
nature of money manager performance.
Why don't Mutual Funds beat the market?
A Bernstein GLobal Wealth Management Report in 2003 says:
According to the International Herald Tribune in 1995: Some reasons for underperformance:
The advantage is you get diversification with a small (<$100,000) portfolio.
See:
What drives the markets: I've heard that hedge funds account for 1/3 of the trading.
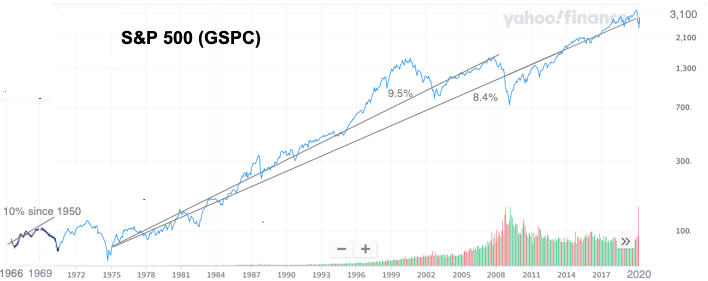
Logarithmic Charts
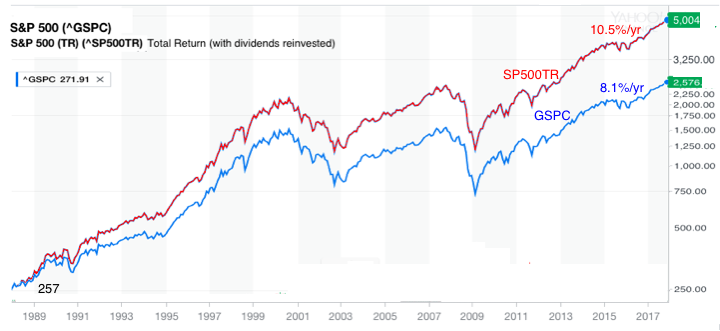
Note: The indexes do not include dividends, which for the S&P average about 2%/year so your actual gain would be higher. (See dividends below)
The normally reported index does not include dividends.
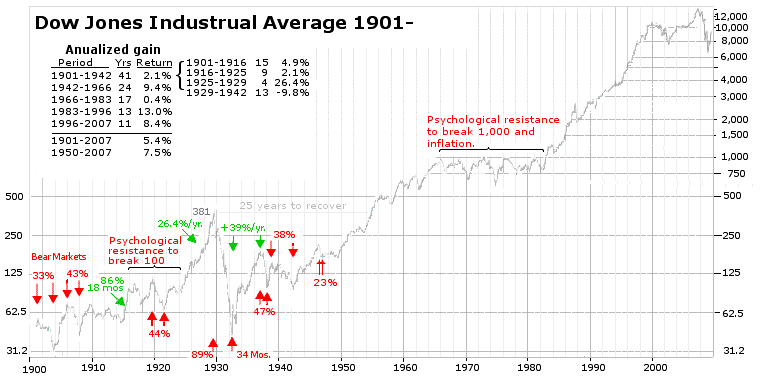
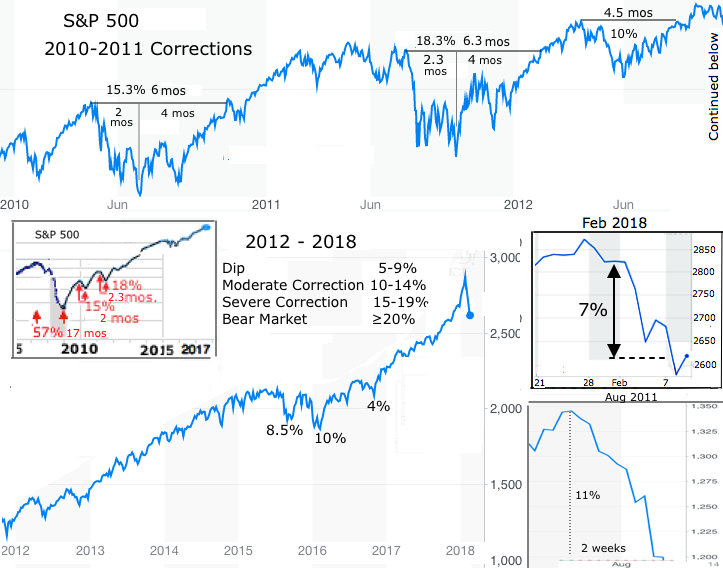
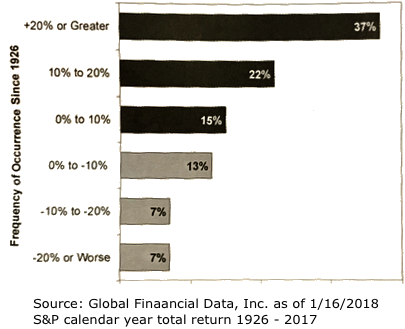
Bear Markets
History of Declines:
Sources:
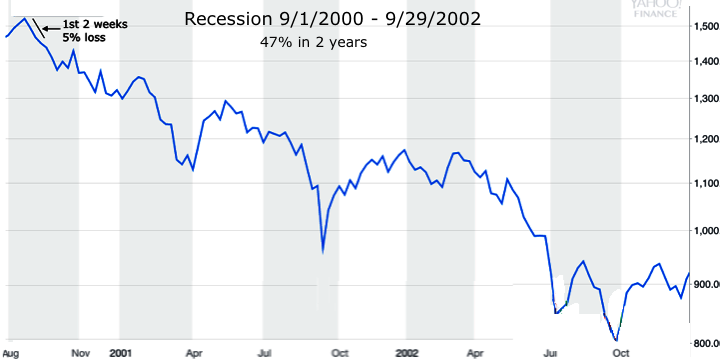
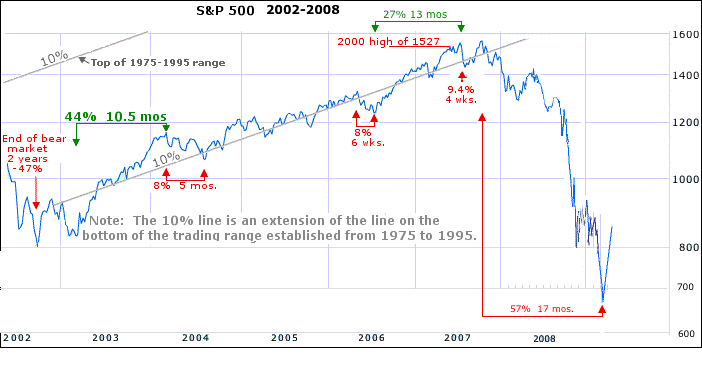
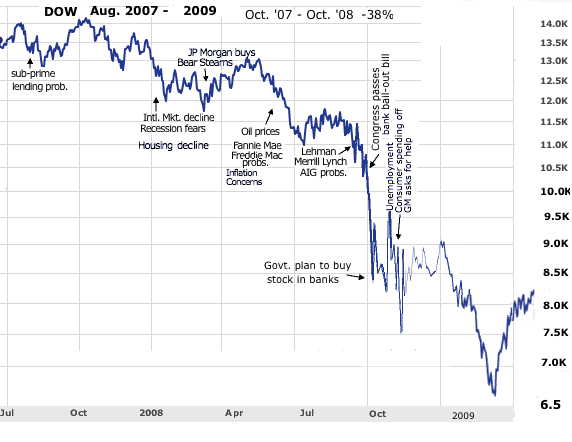
Sub-prime lending market problems in Sept. 2007,
the longest profit slump in six years, the first nationwide decrease in home prices since the Great Depression, record oil prices and fears of a recession resulted the worst bear market in recent history.
Over the weekend and on Monday, Sept. 15, 2008 Merrill Lynch, one of the biggest and best-known brokerage firms in the world, was sold to Bank of America for $50 billion due to financial difficulties stemming from problems in the mortgage markets. Lehman Brothers, unable to find a buyer, filed for bankruptcy . On Wed. the US Federal Reserve struck a deal to take control of AIG in return for an $85bn loan to stave off a collapse of the giant.
After congress passed a $700 B bail-out bill to help the financial credit crunch, credit markets remained frozen.
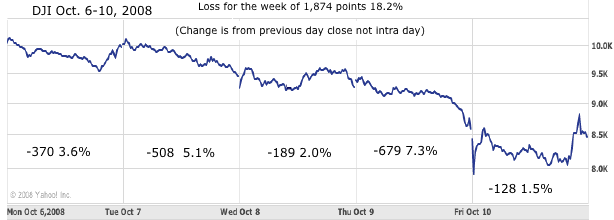
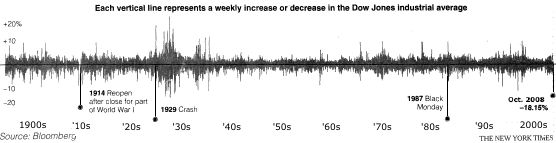
The week of Oct. 6-10 was the worst week in history point wise when the Dow dropped 1,874 points or 18.2% 2nd worst percent loss since the 1929 depression. See 2008 Recession for more.
Can you tell a correction vs a recession by how fast it drops. Fisher Investments says yes.. Big days (Since 1950): DJIA: Largest Daily Loss 1175 4.6% Feb. 5, 2018 DJIA: 2nd largest daily loss 777 7.0% Sept. 29, 2008 DJIA: Daily Loss 685 7.1% Sept. 17, 2001 DJIA: Daily Loss 679 7.3% Oct. 9, 2008 DJIA: Daily Loss 618 5.7% April 14, 2000 DJIA: Largest percent Loss 22.6% October 19, 1987 (black Monday) DJIA: Largest gain 936 11.1% October 13, 2008 * DJIA: 2nd Largest Daily Gain 889 10.9% October 28, 2008 DJIA: 2nd Largest Daily Gain 499 March 16, 2000 DJIA: 3rd Largest % Gain 187 10.2% Oct 21, 1987 * The 11 % gain in Oct., 2008 was bigest since Sept. 1932 (11.4%) or March of 1933 (15.3%) and the fourth-best overall.See Bear Markets
NYSE Market Cap A 2007 article at cross-currents.net talks about how we have turned from investors to traders with the dollar trading volume (DTV) up 18% in 2007 Linear Charts are available on another page.
| |||||||||||||||||||||||||||||||||||||||||||||||||||||||||||||||||||||||||||||||||||||||||||||||||||||||||||||||||||||||||||||||||||||||||||||||||||||||||||||||||
Other Indices:
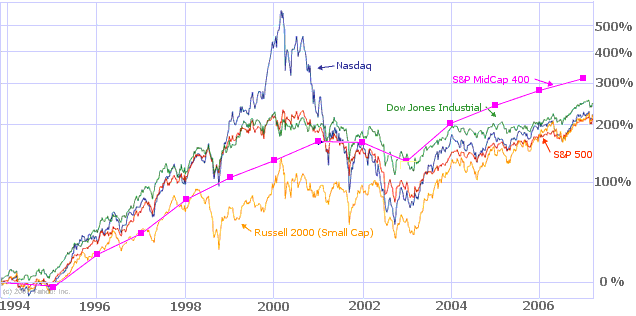
This chart demonstrates the volatility of Nasdaq relative to the other indexes.
The Dow Jones Industrial is the only major indicator (Dow, Nasdaq, S&P) which had recovered from the 2000-2002 bear market 4 1/2 years later (as of March 2007), as people moved to more defensive stocks.
(Note: The numbers below do NOT include dividends. See dividends below)
| Index | 2003 | 2004 | 2005 | 2006 |
|---|---|---|---|---|
| Russell 2000 (RUT) (SmallCap) | 45.4% | 17.0% | 3.3% | 17.0% |
| Amex composite | 42.4% | 22.1% | 22.6% | 16.7% |
| Dow Jones industrials (DJI) (Blue Chip) | 25.3% | 3.1% | -0.6% | 16.3% |
| DJ Wilshire 5000 | 29.4% | 10.8% | 4.6% | 13.9% |
| Standard & Poor's 500 (GSPC) (Broad Market) | 26.4% | 9.0% | 5.7% | 10.7% |
| Standard & Poor's 500 (with dividends) | 28.6% | 11.0% | 7.9% | 12.5% |
| Dow Jones utilities | 24.0% | 25.5% | 20.9% | 12.8% |
| USA TODAY Internet 50 | 66.6% | 8.8% | 1.0% | 11.4% |
| Nasdaq composite (IXIC) (Tech Stocks) | 50.0% | 8.6% | 1.4% | 9.5% |
| Nasdaq 100 (NDX) (largest in Nasdaq) | 49.1% | 10.4% | 1.5% | 6.8% |
| Standard & Poor's midcap 400 (MID) | 34.0% | 15.2% | 11.3% | 9.0% |
| Dow Jones transports | 30.2% | 26.3% | 10.5% | 8.7% |
| USA TODAY Internet/e-Business 25 | 57.5% | 3.1% | -14.6% | 24.7% |
| USA TODAY Internet/e-Consumer 25 | 68.2% | 25.5% | 28.6% | -4.4% |
See: A Fool's Guide to Indexes
Other Indexes:
Reuters CRB Index - Commodity Research Bureau CCI - Continuous Commodity Indexes
Relative performance of Bond funds and International:
Nasdaq 100 Index - 100 of the largest domestic and international non-financial securities listed on The Nasdaq Stock Market, based on market capitalization. The index reflects companies across major industry groups including computer hardware and software, telecommunications, retail/wholesale trade and biotechnology.
The S&P MidCap 400 is the most widely used index for mid-sized companies (mid-caps). Today mid-caps are being recognized as an independent asset class, with risk/reward profiles that differ considerably from both large-ca ps and small-caps. The median capitalization of the S&P 400 companies is $2.7 billion.
The Russel 2000® small-cap Index - Measures is the standard small cap index. It includes the 2,000 smallest companies in the Russell 3000 Index. The index is completely reconstituted annually to ensure larger stocks do not distort the perfor mance and characteristics of the tr ue small-cap opportunity set. The median market capitalization of the Russell 2000 Index is $657 million.* 4Q 2006
| Index | Median Market Cap | P/E |
|---|---|---|
| S&P 500 | $13.2B | |
| NASDAQ- 100 | $9.6B | 29.7 |
| S&P MidCap 400 | $2.7B | |
| Russell 2000 | $657M |
Risk - Volatility:
Small- and medium-capitalization companies tend to have limited liquidity
and greater price volatility than large-capitalization companies. Investments in
foreign securities involve greater volatility and political, economic and
cur rency risks and differences in accounting methods. Investments in debt
securities typically decrease in value when interest rates rise. This risk is
usually greater for longer-term debt securities. Investments in lower-rated and
non-rated securities present a greater risk of loss to principal and interest than
higher-rated securities.
Standard Deviation is one measure of volitility
1955-2004
| Class | Simple Return * | Compound Return | Std Dev σ |
|---|---|---|---|
| small-cap | 15.8% | 12.9% | 20.1% |
| large-cap | 12.5% | 10.9% | 14.6% |
| Corp Bonds | 7.3% | 6.8% | 8.4% |
| T-bills [1] | 5.3% | 5.3% | 0.8% |
Alpha, Beta and Sharpe Ratio are other measures of volitility. See the Glossary page.
1. Risk in long term debt securities (bonds, T-bills) is higher because you are locked into a rate for a longer period of time and price will drop as interest rates go up.
Economic Indicators:
Average annual increase
| 60's | 70's | 80's | 90's | |
|---|---|---|---|---|
| Real GDP | 4.4% | 3.3% | 3.1% | 3.1% |
| Productivity | 2.9% | 2% | 1.4% | 1.9% |
| Employment | 1.9% | 2.4% | 1.7% | 1.3% |
| S&P 500% | 6.6% | -0.5% | 12.9% | 15.9% |
| Real Estate | 6.5% | 10.1% | 11.1% | 5.5% |
| Average level | ||||
| Inflation | 2.3% | 7.1% | 5.6% | 3% |
| Unemployment | 4.5% | 6.2% | 7.3% | 5.8% |
See Macro Economics for some general ideas on economics.
Strategies:
There are a variety of investing strategies:
The greatest enemy of a good plan is the dream of a perfect plan.
von Clausewitz
Several subsequent studies have confirmed that over 90% of the return was due to asset allocation.
Classes have become more complex including things like international stocks, real estate and other investments.
See: Asset allocation
Most investment advisors have gotten away from this increased fixed income strategy.
See Stock - Bond mix in retirement planning.
In the late 1970's Ficher Black of Goldman Sachs, Myron Scholes of Stanford and Robert Merton of Harvard figured out how to price and hedge bond options in a way that guaranteed profits. In 1997 Merton and Scholes won the Nobel price in economics for their work. Only a year later Long Term Capital Management, a highly leveraged hedge fund whose directors included the two Nobelists, collapsed and had to be bailed out to the tune of $3.6 billion by a group of banks.
Bottom-Up (company fundamentals) vs. Top-Down (economic and market sector analysis first)
Types of investements:
Investment in Mutual Funds:
Billions
| Year | Mutual Funds | Index Funds | ETFs |
|---|---|---|---|
| 1996 | 3,526 | 97 | 2 |
| 1998 | 5,525 | 264 | 16 |
| 2000 | 6,965 | 382 | 66 |
| 2002 | 6,390 | 325 | 102 |
| 2004 | 8,107 | 549 | 226 |
| Management expenses * | 1.3-2.5% | 0.2-0.5% | |
| Examples | |||
| S&P 500 | VFINX, FSMKX, PREIX, SPFIX | SPDR (Spiders) SPY † |
|
| Nasdaq | FNCMX | Cubes QQQQ |
Dow Jones Industrial | Diamonds DIA |
| S&P SmallCap 600 | IJR ‡ | ||
| Russell 2000 | IWM | ||
| iShares Core US REIT | USRT | S&P GSCI Commodity-Indexed | GSG |
ETFs (Exchange Traded Funds) vs Index Funds.
Both are designed to match the price of a market index (e.g. the Dow Jones Industrial, S&P 500, etc.)
ETFs can be thought of as a mutual fund that trades like a stock. However, it is not a mutual fund, which has its value calculated at the end of the day; an ETF's price varies throughout the day like the index does. You can also short an ETF like a stock.
Shareholder transaction costs are usually zero for index funds, but this is not the case for ETFs.
ETF's have a creation/redemption in-kind feature of ETFs eliminates the need to sell securities, so minimizing capital gains taxes.
There are other differences like the way dividends are handled.
The bottom line is passive retail investors will usually be better off with Index funds and active traders will benefit from the qualitative advantages of ETFs.
See ETFs vs Index Funds at Investopedia.com.
A common statistic is that the S&P 500 outperforms 80% of mutual funds. While this stat is true in some years, it's not always the case.
Mutual funds have several disadvantages:
Because of the large amount of assets they can only take small positions in individual stocks and can't sell them at one time because they can't find buyers for such large blocks.
Cash float.
Index formulation methodology:
Index formulation methodology could likely have a much greater impact on bottom-line performance than fee structure over time.
Inverse Funds:
In an expected market downturn instead of shorting stocks or an ETF (which requires margin accounts, and liquidity to cover margin calls), there are Inverse funds which will go up when a sector or index goes down. These can be used as hedges to avoid short term cap. gains by selling early or for a market strategy which calls for going short at times.
E.g.:
Rydex Inverse S&P 500 Inv CL (RYURX) - Inverse of S&P 500
Fees: Transaction $75, Mgmt. 0.9%, Distribution fee 0.25%
Short Small Cap ProFund Inv CL (SHPIX) - Inverse of the daily performance of the Russell 2000 Index
Rydex Inverse Russell 2000 CL H (RYSHX) -
The investment advisors who offer free lunches to retired people usually push
equity indexed annuities (EIA) and Insurance.
EIAs have a value tied to a stock index but an minimum return (usually around 3%) and a cap on gians, so they are attractive if you are worried about a stock market decline. However, there are usually caps, spreads, margains and crediting methods that can hinder returns and penalties if you cash in early e.g. less than 5 years. They usually have high comission rates also.
I don't know the pros and cons of these but the contracts are usually many pages with lots of terms and conditions. Some providers are:
Allianz Life
Timing the market
Most recommend sticking with your plan even in down markets. Trying to time when to get out and get back in, usually doesn't work.
At Why Your Investment Returns Could Be Lower Than You Think - Forbes they say,
"A recent Fidelity study showed that investors who got out of the market during the 2008 financial crisis only earned back 2% of their portfolio as of the middle of last year while those who stayed the course, earned back 50%. Those who continued contributing did even better, earning 64%, while those who stayed invested but stopped contributing earned 26%."
See also Dow Theory Forecasts - Special Report "Sitting on the sidelines?"
Option Trading
Options (Puts and Calls) represent the right (but not the obligation) to take some sort of action by a predetermined date. That right is the buying or selling of shares of the underlying stock.
See Option Trading
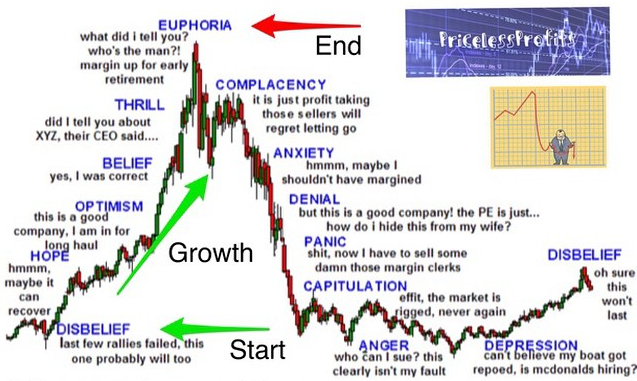
"Bull markets are:
born on pessimism,
grow on skepticism,
mature on optimism and
die on euphoria."
Sir John Templeton
Where to get good advice:
Sample commentaries:
What The Market Is Telling Us
Volatility is back. Ominous signs loom. But the outlook for U.S. markets is surprisingly upbeat. Business Week Mar 12, 2007
Correction or the Beginning of an Imminent Crash? - MarketThoughts.com March 2004
See Macro Economics for Financial terms (GDP, CPI, ...)
Market Gurus
Sir John Templeton - He established the Templeton Growth Fund in 1954.
and sold it to the Franklin group in 1992 to form Franklin Tempelton.
Warren Buffet - Berkshire Hathaway
Peter Lynch - Managed the Fidelity Magellan Fund from 1977 to 1990.
Jack Bogle, Founder of Vanguard
Widely recognized as "the conscience" of the mutual fund industry.
Ken Fisher - (Fisher Investments MarketMinder)
Jim Cramer (Mad Money - CNBC)
Ben Stein
David and Tom Gardner (The Motley Fool)
The Greatest Investors | investopedia
Financial Planning Gurus:
Jonathan Pond
David Bach
Robert Kiyosaki
Suze Orman
Dave Ramsey
Blue Chip Daily Trend Report Larry Tentarelli
Seeking Alpha | Stock Market Analysis & Tools for Investors Rida Morwa
>
See:
QQQ ETF (Nasdaq) Risks and Rewards
8 experts recall their best personal finance advice BankRate.com
The Best Stock Analysts In America - Business Insider
GuruFocus
5 Financial Gurus You've Never Heard Of
Beware the Financial Gurus! Are They All They Are Cracked Up to Be? | cFinancialFreedom.com
Be Careful With Financial 'Gurus' - Business Insider
Siegel's surprising finding is that the new technologies, expanding industries, and fast-growing countries that stockholders relentlessly seek in the market often lead to poor returns.
"The Rules of Risk" by Ron Dembo and Andrew Freeman
"All About Asset Allocation" by Richard Ferri
"More Than You Know" by Michael Mauboussin
"Ahead of the Curve" by Joseph Ellis
If You Can: How Millennials Can Get Rich Slowly, William J. Bernstein, 50 pages
Glossary: See Glossary page.
Links:
Asset Allocation
Send comments and suggestions to
Financial Research | Investment Analytics Tools -- FactSet Research Systems
Market Sectors
Financial Planning
Retirement
More charts
Things to worry about. Concerns.
A Fool's Guide to Indexes
PathoInvesting.org
Quantex Portfolio Planning Software
Technical Analysis
Futures Trading System Rankings
Money, Mutual FUnds, Stocks, Real Estate, ... at thisMatter.com
StockMarketTiming.com
Average Market Returns - Complete Guide To Corporate Finance | Investopedia
LearningStockTrading.blogspot.com
invest-faq.com/
Dave Ahl's Basic Principles of Investing: A Down-to-Earth, No-Nonsense Approach
Return to Finance

 A report in the June 25, 2007