| Household information | 1990 | 1995 | 2000 | 2005 | 2012 | 2014 |
| Income before taxes | $31,889 | $36,918 | $44,649 | $58,712 | $65,596 | $66,877 |
| Average annual increase | | 3.0% | 3.9% | 5.6% | | 4.8% |
| Household income after taxes | $28,937 | $33,864 | $41,532 | $56,304 | | |
| Average annual expenditures (dollars) | $28,381 | $32,264 | $38,045 | $46,409 | $51,442 | $53,495 |
| average annual increase | | 2.6% | 3.4% | 4.1% | | 4.7% |
| Average annual CPI increase | 4.0% | 3.1% | 2.5% | 2.5% | | |
| percent of after tax | 98.1% | 95.3% | 91.6% | 82.4% | | |
| Type of expenditure | 1990 | 1995 | 2000 | 2005 | 2012 | 2014 |
| Housing | 30.7% | 32.4% | 32.4% | 32.7% | 32.8% | 33.3% |
| Transportation | 18.0% | 18.6% | 19.5% | 18.0% | 17.5% | 17.0% |
| Food | 15.1% | 14.0% | 13.6% | 12.8% | 12.8% | 12.6% |
| Personal insurance and pensions | 9.1% | 9.2% | 8.8% | 11.2% | 10.9% | 10.7% |
| Utilities, fuels, and public services | 6.7% | 6.8% | 6.5% | 6.9% | | |
| Health care | 5.2% | 5.4% | 5.4% | 5.7% | 6.9% | 8.0% |
| Entertainment | 5.0% | 5.0% | 4.9% | 5.1% | 5.1% | 5.1% |
| Apparel and services | 5.7% | 5.3% | 4.9% | 4.1% | 3.4% | 3.3% |
| Household furnishings and equipment | 4.0% | 4.3% | 4.1% | 3.8% | | |
| Health Insurance | | | | | 4.0% | 5.4% |
| Other | % | % | % | % | 6.9% | 6.6% |
Details below
Source:
Income, Expenditures, Poverty, and Wealth | census.gov
CONSUMER EXPENDITURES - 2014 (bls.gov/news.release/pdf/cesan.pdf)
Consumer Expenditures at (www.census.gov/compendia/statab/cats/
income_expenditures_poverty_wealth/consumer_expenditures.html)
Consumer Price Index (www.bls.gov/schedule/archives/cpi_nr.htm)
See details below.
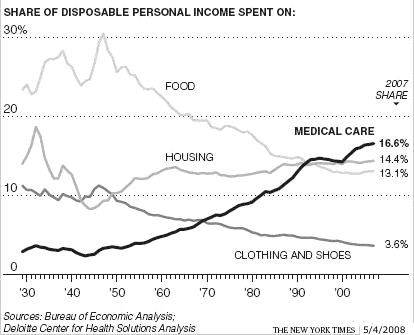
"Even the Insured Feel Strain of Health Costs", in the NY Times Sun. May 4, 2008
See Healthcare
Personal consumption expenditures
at the Bureau of Economic Analysis bea.gov
| Type | 1990 | 1995 | 2000 | 2005 | 2007 |
| Durable goods | 9.5% | 11.6% | 15.4% | 16.5% | 15.4% |
| Motor vehicles and parts | 5.4% | 5.7% | 6.9% | 6.5% | 5.6% |
| Furniture and household equipment | 2.5% | 2.5% | 3.4% | 4.8% | 6.8% |
| Other | 1.9% | 2.3% | 2.9% | 3.0% | 2.8% |
| Nondurable goods | 31.1% | 34.3% | 34.7% | 32.6% | 29.7% |
| Food | 16.4% | 17.3% | 16.5% | 15.2% | 13.9% |
| Clothing and shoes | 3.9% | 4.8% | 5.3% | 5.4% | 5.1% |
| Gasoline, fuel oil, and other energy goods | 3.3% | 3.3% | 3.1% | 2.8% | 2.5% |
| Gasoline and oil | 3.0% | 3.2% | 3.1% | 2.7% | 2.3% |
| Fuel oil and coal | 0.4% | 0.4% | 0.3% | 0.2% | 0.2% |
| Other | 7.6% | 8.7% | 9.5% | 9.2% | 8.5% |
| Services | 59.8% | 68.2% | 69.9% | 64.1% | 58.1% |
| Housing | 16.8% | 18.6% | 17.9% | 16.2% | 14.6% |
| Household operation | 5.6% | 6.5% | 6.9% | 6.0% | 5.3% |
| Electricity and gas | 2.5% | 2.7% | 2.6% | 2.2% | 2.0% |
| Other household operation | 3.1% | 3.8% | 4.4% | 3.8% | 3.3% |
| Transportation | 4.1% | 4.9% | 5.2% | 4.2% | 3.7% |
| Medical care | 16.7% | 19.0% | 18.3% | 18.2% | 16.6% |
| Recreation | 3.6% | 4.6% | 4.8% | 4.5% | 4.2% |
| Other | 13.0% | 14.7% | 16.8% | 15.0% | 13.7% |
See details below
Table 2.3.6U. Real Personal Consumption Expenditures by Major Type of Product and Expenditure, at the Bureau of Economic Analysis (BEA.gov)
Detail Spending
| Item | 2010 | 2011 | 2012 | 2013 | percent change |
| 2010-2011 | 2011-2012 | 2012-2013 |
| Number of consumer units (in thousands) | 121,107 | 122,287 | 124,416 | 125,670 |
| Consumer unit characteristics: | |
|
|
|
|
|
|
| Income before taxes | $62,481 |
$63,685 |
$65,596 |
$63,784 |
|
|
|
| Age of reference person | 49.4 |
49.7 |
50 |
50.1 |
|
|
|
| Percent homeowner | 66 |
65 |
64 |
64 |
|
|
|
| Average annual expenditures | $48,109 |
$49,705 |
$51,442 |
$51,100 |
3.3% |
3.5% |
-0.7% |
| Food | $6,129 |
$6,458 |
$6,599 |
$6,602.00 |
5.4% |
2.2% |
0.0% |
| Food at home | 3,624 |
3,838 |
3,921 |
3,977 |
5.9% |
2.2% |
1.4% |
| Cereals and bakery products | 502 |
531 |
538 |
544 |
5.8% |
1.3% |
1.1% |
| Meats, poultry, fish, and eggs | 784 |
832 |
852 |
856 |
6.1% |
2.4% |
0.5% |
| Dairy products | 380 |
407 |
419 |
414 |
7.1% |
2.9% |
-1.2% |
| Fruits and vegetables | 679 |
715 |
731 |
751 |
5.3% |
2.2% |
2.7% |
| Other food at home | 1,278 |
1,353 |
1,380 |
1,412 |
5.9% |
2.0% |
2.3% |
| Food away from home | 2,505 |
2,620 |
2,678 |
2,625 |
4.6% |
2.2% |
-2.0% |
| Alcoholic beverages | 412 |
456 |
451 |
445 |
10.7% |
-1.1% |
-1.3% |
| Housing | 16,557 |
16,803 |
16,887 |
17,148 |
1.5% |
0.5% |
1.5% |
| Shelter | 9,812 |
9,825 |
9,891 |
10,080 |
0.1% |
0.7% |
1.9% |
| Owned dwellings | 6,277 |
6,148 |
6,056 |
6,108 |
-2.1% |
-1.5% |
0.9% |
| Rented dwellings | 2,900 |
3,029 |
3,186 |
3,324 |
4.4% |
5.2% |
4.3% |
| Other lodging | 635 |
648 |
649 |
649 |
2.0% |
0.2% |
0.0% |
| Utilities, fuels, and public services | 3,660 |
3,727 |
3,648 |
3,737 |
1.8% |
-2.1% |
2.4% |
| Household operations | 1,007 |
1,122 |
1,159 |
1,144 |
11.4% |
3.3% |
-1.3% |
| Housekeeping supplies | 612 |
615 |
610 |
645 |
0.5% |
-0.8% |
5.7% |
| Household furnishings and equipment | 1,467 |
1,514 |
1,580 |
1,542 |
3.2% |
4.4% |
-2.4% |
| Apparel and services | 1,700 |
1,740 |
1,736 |
1,604 |
2.4% |
-0.2% |
-7.6% |
| Transportation | 7,677 |
8,293 |
8,998 |
9,004 |
8.0% |
8.5% |
0.1% |
| Vehicle purchases (net outlay) | 2,588 |
2,669 |
3,210 |
3,271 |
3.1% |
20.3% |
1.9% |
| Gasoline and motor oil | 2,132 |
2,655 |
2,756 |
2,611 |
24.5% |
3.8% |
-5.3% |
| Other vehicle expenses | 2,464 |
2,454 |
2,490 |
2,584 |
-0.4% |
1.5% |
3.8% |
| Public and other transportation | 493 |
516 |
542 |
537 |
4.7% |
5.0% |
-0.9% |
| Healthcare | 3,157 |
3,313 |
3,556 |
3,631 |
4.9% |
7.3% |
2.1% |
| Entertainment | 2,504 |
2,572 |
2,605 |
2,482 |
2.7% |
1.3% |
-4.7% |
| Personal care products and services | 582 |
634 |
628 |
608 |
8.9% |
-0.9% |
-3.2% |
| Reading | 100 |
115 |
109 |
102 |
15.0% |
-5.2% |
-6.4% |
| Education | 1,074 |
1,051 |
1,207 |
1,138 |
-2.1% |
14.8% |
-5.7% |
| Tobacco products and smoking supplies | 362 |
351 |
332 |
330 |
-3.0% |
-5.4% |
-0.6% |
| Miscellaneous | 849 |
775 |
829 |
645 |
-8.7% |
7.0% |
-22.2% |
| Cash contributions | 1,633 |
1,721 |
1,913 |
1,834 |
5.4% |
11.2% |
-4.1% |
| Personal insurance and pensions | 5,373 |
5,424 |
5,591 |
5,529 |
0.9% |
3.1% |
-1.1% |
| Life and other personal insurance | 318 |
317 |
353 |
319 |
-0.3% |
11.4% |
-9.6% |
| Pensions and Social Security | 5,054 |
5,106 |
5,238 |
5,209 |
1.0% |
2.6% |
-0.6% |
Source: Consumer Expenditures in 2013 (www.bls.gov/cex/csxann13.pdf)
By Age
Source: Generational Table | bls.gov, 2014
By Income
Source: How the Rich and Poor Spend Money Today--and 30 Years Ago - The Atlantic, 2014
Change over Time:
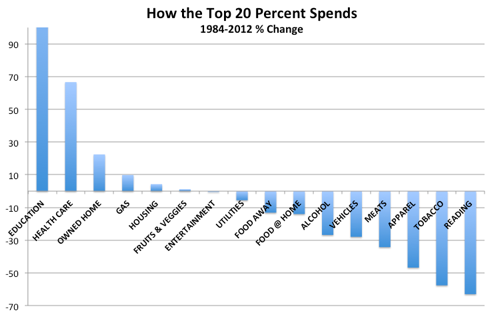
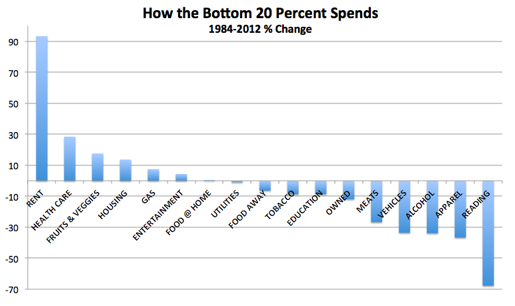
Source: How the Rich and Poor Spend Money Today--and 30 Years Ago - The Atlantic, 2012
Location - Location - Location:
Living Wage Calculator | MIT Examples
| San Francisco | | Sacramento | | Somerset, NJ | | Durham, NC |
| 2 Adults | 2 Adults 1 Child | | 2-A | 2-A 1-C | | 2-A | 2-A 1-C | | 2-A | 2-A 1-C |
| Housing+utilities | 39% |
41% | |
27% |
27% |
|
33% |
34% |
|
23% |
23% |
| Transportation | 20% |
15% | |
23% |
18% |
|
21% |
16% |
|
29% | 23% |
| Food | 17% |
14% | |
21% |
17% |
|
19% |
15% |
|
18% |
15% |
| Child Care | 0% |
12% |
|
0% |
15% |
|
0% |
15% |
|
0% |
14% |
| Medical | 12% |
10% | |
15% |
13% |
|
14% |
12% |
|
16% |
14% |
| Other | 12% |
8% | |
14% | 10% |
|
12% |
9% |
|
14% | 11% |
| Required annual income after taxes | $37,053 |
$57,804 |
|
$31,365 |
$47,196 |
|
$33,295 |
$51,533 |
|
$30,288 |
$44,457 |
| Annual taxes | $5,195 |
$8,104 |
|
$4,397 |
$6,617 |
|
$4,418 |
$6,838 |
|
$5,609 |
$8,233 |
| Required annual income before taxes | $42,248 |
$65,908 |
|
$35,762 |
$53,812 |
|
$37,713 |
$58,371 |
|
$35,897 |
$52,691 |
| Fairfield, CT | | Jackson, MS | | Boston, MA | | Minneapolis, MN |
|
2 Adults | 2 Adults 1 Child | |
2-A | 2-A 1-C | |
2-A | 2-A 1-C | |
2-A | |
| Housing+utilities | 33% |
32% |
|
25% |
24% |
|
34% |
31% |
|
24% |
25% |
| Transportation | 21% |
15% |
|
28% |
24% |
|
20% |
15% | |
28% |
21% |
| Food | 19% |
15% |
|
22% | 21% |
|
18% |
15% |
|
19% |
15% |
| Child Care | 0% |
18% |
|
0% |
9% | |
0% |
19% | |
0% |
16% |
| Medical | 15% |
11% |
|
16% |
16% | |
15% |
12% |
|
15% |
13% |
| Other | 12% |
9% |
|
14% | 11% |
|
12% |
8% | |
14% | 10% |
| Required annual income after taxes | $33,271 |
$52,530 |
|
$31,226 |
$41,675 |
|
$34,245 |
$53,295 |
|
$29,841 |
$45,429 |
| Annual taxes | $5,496 |
$8,678 |
|
$4,846 |
$6,468 |
|
$5,760 |
$8,964 |
|
$5,541 |
$8,436 |
| Required annual income before taxes | $38,768 |
$61,208 |
|
$36,073 |
$48,143 |
|
$40,005 |
$62,259 |
|
$35,382 |
$53,865 |
Housing assumes 1 bedroom rental for 2 Adults and 2 bedroom rental with 1 Child.
Two Examples - San Francisco (high housing cost) - Minneapolis-St. Paul (low housing costs)
San Francisco
| Annual Expenses | 1 Adult | 1 Adult 1 Child | 1 Adult 2 Children | 1 Adult 3 Children | 2 Adults (One Working) | 2 Adults (One Working) 1 Child | 2 Adults (One Working) 2 Children | 2 Adults | 2 Adults 1 Child | 2 Adults 2 Children |
|
| Food | $3,530 |
$5,206 |
$7,822 |
$10,385 |
$6,472 |
$8,058 |
$10,392 |
$6,472 |
$8,058 |
$10,392 |
| Child Care | $0 |
$7,209 |
$10,073 |
$12,936 |
$0 |
$0 |
$0 |
$0 |
$7,209 |
$10,073 |
| Medical | $2,134 |
$6,138 |
$5,967 |
$5,827 |
$4,626 |
$5,967 |
$5,827 |
$4,626 |
$5,967 |
$5,827 |
| Housing | $14,292 |
$23,472 |
$23,472 |
$31,884 |
$18,612 |
$23,472 |
$23,472 |
$14,292 |
$23,472 |
$23,472 |
| Transportation | $3,727 |
$7,367 |
$8,421 |
$9,414 |
$7,367 |
$8,421 |
$9,414 |
$7,367 |
$8,421 |
$9,414 |
| Other | $2,374 |
$4,295 |
$4,677 |
$5,459 |
$4,295 |
$4,677 |
$5,459 |
$4,295 |
$4,677 |
$5,459 |
| Required annual income after taxes | $26,057 |
$53,688 |
$60,431 |
$75,905 |
$41,373 |
$50,594 |
$54,564 |
$37,053 |
$57,804 |
$64,637 |
| Annual taxes | $3,653 |
$7,527 |
$8,472 |
$10,642 |
$5,800 |
$7,093 |
$7,650 |
$5,195 |
$8,104 |
$9,062 |
| Required annual income before taxes | $29,710 |
$61,215 |
$68,903 |
$86,547 |
$47,173 |
$57,688 |
$62,214 |
$42,248 |
$65,908 |
$73,699 |
Minneapolis-St. Paul-Bloomington, MN-WI
| Annual Expenses | 1 Adult | 1 Adult 1 Child | 1 Adult 2 Children | 1 Adult 3 Children | 2 Adults (One Working) | 2 Adults (One Working) 1 Child | 2 Adults (One Working) 2 Children | 2 Adults | 2 Adults 1 Child | 2 Adults 2 Children |
| Food | $3,021 |
$4,456 |
$6,695 |
$8,888 |
$5,539 |
$6,897 |
$8,894 |
$5,539 |
$6,897 |
$8,894 |
| Child Care | $0 |
$7,158 |
$11,811 |
$16,464 |
$0 |
$0 |
$0 |
$0 |
$7,158 |
$11,811 |
| Medical | $2,353 |
$6,174 |
$6,002 |
$5,863 |
$4,541 |
$6,002 |
$5,863 |
$4,541 |
$6,002 |
$5,863 |
| Housing | $7,296 |
$11,352 |
$11,352 |
$15,984 |
$9,072 |
$11,352 |
$11,352 |
$7,296 |
$11,352 |
$11,352 |
| Transportation | $4,189 |
$8,281 |
$9,464 |
$10,581 |
$8,281 |
$9,464 |
$10,581 |
$8,281 |
$9,464 |
$10,581 |
| Other | $2,312 |
$4,184 |
$4,555 |
$5,317 |
$4,184 |
$4,555 |
$5,317 |
$4,184 |
$4,555 |
$5,317 |
| Required annual income after taxes | $19,172 |
$41,604 |
$49,880 |
$63,097 |
$31,617 |
$38,271 |
$42,007 |
$29,841 |
$45,429 |
$53,818 |
| Annual taxes | $3,560 |
$7,726 |
$9,263 |
$11,717 |
$5,871 |
$7,107 |
$7,801 |
$5,541 |
$8,436 |
$9,994 |
| Required annual income before taxes | $22,732 |
$49,330 |
$59,142 |
$74,814 |
$37,488 |
$45,378 |
$49,808 |
$35,382 |
$53,865 |
$63,812 |
2014 Annual Average Cost of living (Missouri Economic Research and Information Center (MERIC)) - Examples
| State | Index | Grocery | Housing | Utilities | Transpor-
ation | Health | Misc. |
| Mississippi | 86.9 |
91.0 |
72.5 |
86.1 |
94.2 |
91.7 |
94.6 |
| Tennessee | 89.3 |
93.2 |
77.3 |
91.0 |
93.6 |
89.8 |
96.0 |
| Idaho | 90.2 |
93.1 |
75.7 |
86.6 |
103.9 |
99.9 |
96.3 |
| Michigan | 91.8 |
94.2 |
80.6 |
96.3 |
99.5 |
94.8 |
95.7 |
| Texas | 92.8 |
90.7 |
86.2 |
93.4 |
96.3 |
94.9 |
97.8 |
| North Carolina | 96.5 |
102.5 |
85.9 |
99.7 |
98.5 |
105.4 |
100.2 |
| Virginia | 97.0 |
96.4 |
93.3 |
103.7 |
93.2 |
98.6 |
99.7 |
| Florida | 99.8 |
104.1 |
95.5 |
101.2 |
103.0 |
98.5 |
100.2 |
| Arizona | 100.2 |
100.9 |
101.1 |
96.6 |
100.7 |
101.9 |
100.0 |
| Colorado | 101.3 |
97.2 |
109.4 |
90.8 |
101.8 |
104.3 |
98.7 |
| Minnesota | 101.5 |
105.4 |
97.1 |
89.4 |
101.8 |
103.9 |
107.2 |
| Nevada | 101.6 |
108.8 |
96.9 |
86.1 |
106.1 |
98.6 |
106.4 |
| Pennsylvania | 102.1 |
103.0 |
99.2 |
107.9 |
102.6 |
95.2 |
103.2 |
| New Hampshire | 115.6 |
97.9 |
128.1 |
124.5 |
99.1 |
118.1 |
115.5 |
| Massachusetts | 123.5 |
104.7 |
140.9 |
126.1 |
114.7 |
118.7 |
119.5 |
| New Jersey | 126.7 |
106.3 |
165.1 |
114.3 |
108.3 |
106.6 |
115.7 |
| California | 128.7 |
114.5 |
175.7 |
113.4 |
113.8 |
110.5 |
106.7 |
| New York | 133.3 |
109.8 |
191.7 |
106.1 |
112.0 |
104.4 |
113.1 |
| Connecticut | 145.2 |
117.1 |
208.4 |
127.7 |
118.5 |
110.7 |
122.7 |
| Hawaii | 164.0 |
157.1 |
210.3 |
238.4 |
125.8 |
113.5 |
123.5 |
The biggest difference is in housing, with Conn. more than twice as expensive than Mississippi and Utilities (Conn. is 50% more than Miss.).
See Cost of Living 2014 Annual Average | Missouri Economic Research and Information Center (MERIC) for all states.
Living Wage Calculator - Introduction to the Living Wage Calculator | MIT
Links:
See also
Consumer Expenditures at (census.gov)
Budgeting
Return to Finance
last updated 5 May 2008
|
