| Financial Planning | Budgeting | Saving | Investing | Retirement | Senior Living Costs | Real Estate | Interest Rates | Charts |
Under Construction 
General Guidelines
Salary
$35K
30%    Housing
10%   Utilities and other housing expenditures (including renters insurance)
40%   Housing + Utilities
15%   Food (at home and away)
10%   Transportation (including car loan)
10%   Debt repayment (student loans and credit cards)
10%   Saving
 5%   Clothing
 5%   Entertainment
 5%   Car insurance and miscellaneous personal expenses
Source:Home Budget: Cost-Of-Living Reality Check - Quicken Support
Source: Family Budget: How to go Broke on $100,000 a year. Why the Middle Class has a hard time Living in Expensive Urban Areas.| mybudget360.com, 2008 Debt: Bank of America, which adheres to the guidelines that Fannie Mae and Freddie Mac set, will let your total debt (including student and other loans) hit 45 percent of your pretax income, but no more. Dave Ramsey, who takes a conservative view, wants your housing payment (including property taxes and insurance) to be no more than 25 percent of your take-home income. It's hard to make generic rules for budgets. It depends on, Where you live: The Missouri Economic Research and Information Center (MERIC) computes a cost of living index by state. Hawaii is 90% more expensive than Mississippi, California is 43% more expensive than Iowa. The biggest difference is in housing, with Conn. more than twice as expensive as Mississippi while food is only 35% more. See Cost of living by location in Household Spending
Your family situation:
Your phase in life:
Your income:
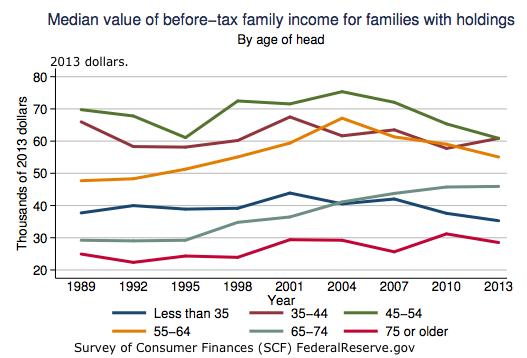
See Household Spending 1990-2014
There is a big range depending on the factors above.
The percentage below are based on a person earning just enough to get buy.
2 adults:         $35,000-$44,000
2 adults 1 child: $48,000-$65,000
2 adults Housing+utilities 23-42% Durhan, NC - 23%, San Francisco, CA - 42% Transportation 15-29% Fairfield, CT - 15% Durhan, NC - 29% Food 14-22% Sacramenot, CA- 14% Jacks0n, MS - 22% Child Care Medical 10-16% Other 8-14% 2 adults both working, 1 child Housing+utilities 15-41% Boston, MA- 15%, San Francisco, CA - 41% Transportation 15-24% Fairfield, CT- 15% Jackson, MS - 24% Food 12-21% Boston, MA - 12% Jackson, MS - 21% Child Care % Medical % Other % Source: Living Wage Calculator - Introduction to the Living Wage Calculator | MIT By Age - Generational Table: Source: Generational Table | bls.gov, 2014 Lifetime Earnings: - Pay by age 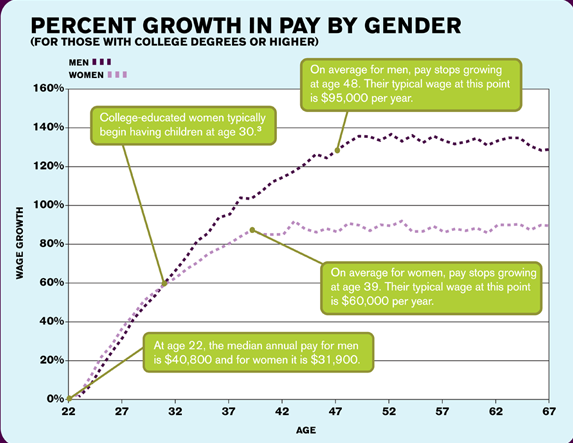 This shows that at age 39 a woman's salary is $60,000/year, 88% higher than it was at age 22, $31,900/year. A man's salary at age 48 is $95,000/year, 130% higher than it was at age 22, $40,800/yr. Source: Do Men Really Earn More Than Women? - Infographic - PayScale.com (2012) Ref: BLS.gov For people with college or graduate degrees. There are several reasons. There are more men in higher paying jobs, software developer, construction project manager. While there are more women in jobs like elementary school teacher, Human resources manager. For those in the same job categories pay is closer. The male software developer median, annual salary is $65,700, which is 4 percent more than the median female value of $63,300. Women also take off more time for children after the age of 30.
Percentage of families holding specific types of assets:
See Net Worth by age on the Retirement planning page.
Saving vs Spending by life stage:
In Stein-DeMuth's "Yes, You Can Get A Financial Life!", they list the following saving stages.
Figure 7.3: Recommended Annual Contributions to our Withdrawls from Savings for One-Child, Median-Income Family to Maintain an Even Lifestyle when Buying a House.
See: Create an emergency fund Most people It should be 3-6 months of your expenses (More or less depending on your employment stability). e.g. if your expenses are $5,000/mo you should have $15-$30,000 in your emergency fund. Emergencies are things like loosing a job, medical or dental expenses, break downs (car, Air Conditioning, appliances, computer, ...), travel for a family funeral, a tree falls on your house, .... Some typical costs (very rough gestimate): Item When Cost Auto timing belt/chain 100,000 mi $300-$1,000 Auto CV boot 50-60,000 $150-$600 Household appliances 10-15 yrs $250-$700 Refrig. $350-$2,000 Air Conditioner 12-15 yrs $5,000 Furnace 15-20 yrs $4,000 Asphalt Shingles 20-25 yrs $12,000 Dental crown $800 - $1,400 Dental Implant $2,000 - $6,000 Average Life Span of Homes, Appliances, and MechanicalsIt is important to keep this emergency fund in a place that will fairly liquid so that you can get to the money quickly in the event of an emergency. You don't want to have this money tied into stocks or mutual funds because the volatility of the market could cause you to lose money over the short-term. Start with a savings account, then move to something that will give you a little more interest, money market accounts or certificate of deposits (CDs). See Why You Need an Emergency Fund | FinancialPlan.about.com See What Counts as a Financial 'Emergency'? | LearnVest.com See also Economics at Best Places to Live Tools: ESPlanner Inc. QUANTEXT Portfolio Planner Links: Household Spending Data (from census.gov and other sources) Living Wage Calculator - Introduction to the Living Wage Calculator | MIT Cost of Living 2nd Quarter Cost of Living in Best Places to Live Saving Investing Retirement Medical Service Costs
| ||||||||||||||||||||||||||||||||||||||||||||||||||||||||||||||||||||||||||||||||||||||||||||||||||||||||||||||||